A model can find structure even when the process has none.
Machine learning is excellent at fitting data. The hard question is whether the fitted relationship survives a future draw and beats a transparent baseline.
Define the system before judging the result
Machine learning is excellent at fitting data. The hard question is whether the fitted relationship survives a future draw and beats a transparent baseline. A useful definition names what is inside the decision, what remains outside it and which entity owns each attribute. Without that boundary, words such as “accurate,” “accessible,” “large,” “safe” or “high capacity” can quietly change meaning between the claim and the conclusion.
The framework on this page separates an observation from an inference and an inference from an action. That distinction matters because a plausible story can still be unsupported. Record the source, date and scope of each input; identify which value would change the decision; and keep unknowns visible. When a result depends on a current price, rule, business status, weather event or site condition, verify it again at the moment of use. The goal is not perfect certainty. It is a decision that another reader can reconstruct, challenge and update without relying on confidence language.
- Feature
- A measurable input supplied to a model, such as draw date, frequency window or encoded ball position.
- Target
- The outcome the model is asked to estimate. A vague target makes performance claims impossible to interpret.
- Data leakage
- Information from the future or test set that accidentally reaches training and inflates reported accuracy.
- Baseline
- A simple reference method, usually uniform random selection or historical marginal frequency, that a complex model must beat.
Use an EAV decision framework
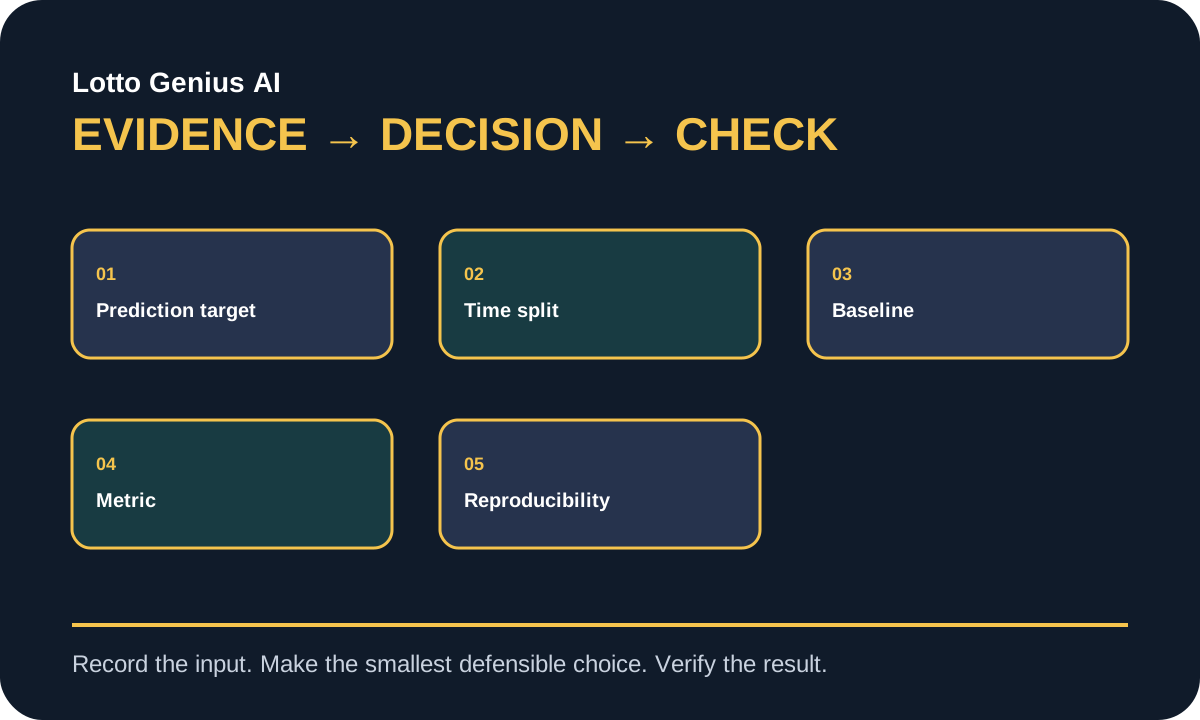
Entity–attribute–value thinking turns a vague topic into checkable fields. The entity is the thing being evaluated; the attribute is the property that matters; the value is the measured, quoted or observed state. Keep units, dates and sources attached to values. The table below is a working decision framework rather than a list of generic tips.
| Variable | Evidence to collect | Decision rule |
|---|---|---|
| Prediction target | Exact line, individual ball probability, prize tier or ranking | Choose one metric that matches the stated use. |
| Time split | Random split versus chronological holdout | Use chronological evaluation for a future-facing claim. |
| Baseline | Uniform random, frequency rule or simple logistic model | Publish all baselines next to the proposed model. |
| Metric | Log loss, calibration, hit rate or return | Avoid a metric that rewards trivial near-misses. |
| Reproducibility | Code, seed, dataset and preprocessing | A result without a repeatable pipeline remains a demonstration. |
Run the workflow in order
Use the sequence below as a small operating procedure. Each step creates evidence for the next, and the final step checks whether the original problem changed. Do not skip directly from a symptom or marketing claim to a purchase. If a required input is unavailable, label the choice provisional and prefer a reversible action. A written sequence also prevents hindsight from rewriting why the decision was made.
- Define one falsifiable task before opening the dataset, including the exact prediction horizon and scoring rule. After completing it, save the supporting note, measurement or confirmation so the next step does not depend on memory.
- Freeze a chronological test period that will not influence feature design, parameter tuning or narrative selection. After completing it, save the supporting note, measurement or confirmation so the next step does not depend on memory.
- Build a uniform random baseline and at least one simple descriptive baseline using the same number of tickets and constraints. After completing it, save the supporting note, measurement or confirmation so the next step does not depend on memory.
- Train the model only on earlier data, record every transformation, and test for leakage from timestamps, sort order and post-draw fields. After completing it, save the supporting note, measurement or confirmation so the next step does not depend on memory.
- Score all methods on the frozen period, add uncertainty intervals, and repeat the comparison as new draws arrive without rewriting the original hypothesis. After completing it, save the supporting note, measurement or confirmation so the next step does not depend on memory.
Work through a bounded example
A neural network is trained on ten years of draw records and reports 92 percent “accuracy.” Inspection shows that the target is whether any predicted number appears among several drawn numbers, while the model is allowed to output a large candidate set. A random method using the same candidate-set size achieves nearly the same score. The headline metric was mathematically true but operationally unhelpful. A better report states the target, ticket count, baseline, chronological test window and calibration, then shows whether any advantage remains after those controls. This worked example is deliberately bounded: it does not prove that the same answer applies to every property, game, traveler or roof. It demonstrates how entities and attributes become a decision record. A strong record includes the competing options, the limiting constraint, the evidence used, the action taken and the observation that would trigger a revision.
Decision record: write the initial claim, evidence date, limiting constraint, selected action, expected observation and review date in one place. This compact record makes later updates honest and makes the method teachable.
Check predictable failure modes
Most bad outcomes begin with a missing denominator, an unverified current fact, a hidden constraint or a comparison between unequal options. Review these failure modes before the decision becomes expensive or difficult to reverse.
- Failure mode: Using a random train/test split that lets later draw patterns shape preprocessing applied to earlier examples. The repair is to return to the missing input, make it observable and compare the revised choice with the original baseline.
- Failure mode: Selecting the best-performing model from hundreds of trials and reporting it as though only one hypothesis was tested. The repair is to return to the missing input, make it observable and compare the revised choice with the original baseline.
- Failure mode: Calling a large candidate set accurate without comparing the same-size random set. The repair is to return to the missing input, make it observable and compare the revised choice with the original baseline.
- Failure mode: Changing features or thresholds after seeing test results while continuing to label the period “unseen.” The repair is to return to the missing input, make it observable and compare the revised choice with the original baseline.
Verify with primary or authoritative sources
The framework on this page separates an observation from an inference and an inference from an action. That distinction matters because a plausible story can still be unsupported. Record the source, date and scope of each input; identify which value would change the decision; and keep unknowns visible. When a result depends on a current price, rule, business status, weather event or site condition, verify it again at the moment of use. The goal is not perfect certainty. It is a decision that another reader can reconstruct, challenge and update without relying on confidence language. Editorial review on this site favors official rules, government guidance, standards bodies and clearly identified primary documentation. A source supports only the claim it actually addresses; it does not transfer authority to unrelated conclusions.
- Google Machine Learning Rules — consult the current version and jurisdiction-specific guidance.
- NIST AI Risk Management Framework — consult the current version and jurisdiction-specific guidance.
Continue through the topic map
Use the related guides to test adjacent assumptions and build a complete decision rather than treating one page as a universal answer.